Takayuki's Own Projects
This Web page firstly introduces my own projects at Ochanomizu University. Source codes developed with Java 1.8 and JOGL 2.2 are uploaded on GitHub. Excuse me that sufficient documents and sample datasets are not yet provided on GitHub. They will be prepared on demand. HeiankyoView and Hidden are used for exercise courses for my undergrad and masters' students.
|
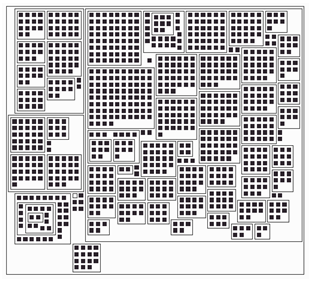
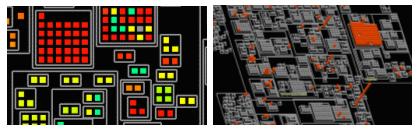
HeiankyoView
is a tree data visualization technique representing leaf-nodes as colored icons and branch nodes as rectangular borders. Heiankyo is the ancient palace in Kyoto, Japan. We named HeiankyoView because the visualization resulus look like the map of Heiankyo, and also, this projects has started when I was a part-time researcher at Kyoto University.
Paper (published by IEEE Computer Graphics and Applications in 2006) Code(GitHub) |
|
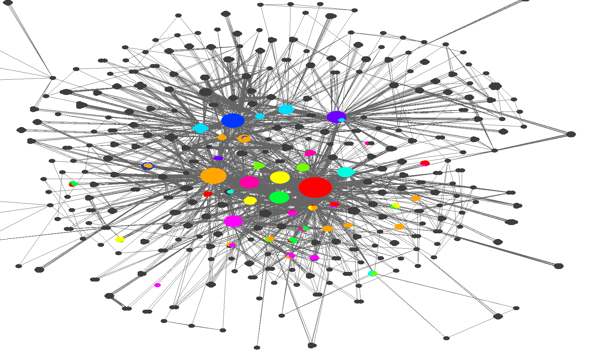
Koala
(Key-node Out Arrangement and LAyout) is a graph visualization technique which applies a graph clustering algorithm while separating important nodes connected to large number of other nodes from large clusters. It effectively represents relationships between such important nodes and clusters of other nodes by applying an edge bundling technique.
Paper (published by IEEE Computer Graphics and Applications in 2015) Code(GitHub) |
|
|
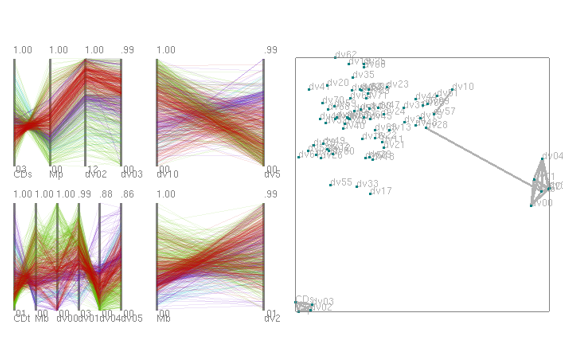
Hidden
(HIgh Dimensional Data Exploration and Navigation) is a high-dimensional data visualization technique which represents high-dimensional data values as automatically selected sets of low-dimensional parallel coordinate plots. It assists to understand relationships among dimensions by simultaneously displaying the dimension scatterplots. The technique also assists to understand relationships among dimensions and labels by applying an association rule mining technique.
Paper (published by Journal of Visual Languages and Computing in 2017) Code(GitHub) |
Following are my own projects while working for IBM Research during 1992 to 2004.
Please click thumbnail images to get into old Web page describing the details of the projects.
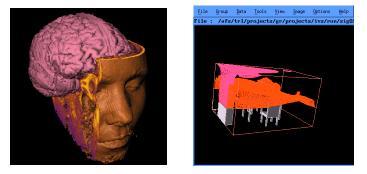
Isosurface is a set of polygons, which interpolates the set of points that have the equal value in a 3D scalar field. It is mainly applied to visualize the results of numerical simulations such as finite element analysis, or medical measurements such as CT or MRI. We have reported the extrema skeleton method, that dramatically reduces the computation time to generate isosurfaces.
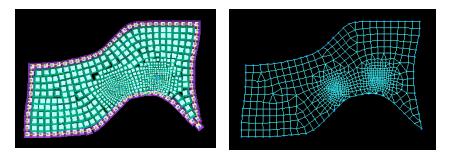
Quadrilateral mesh is preferred in some numerical analyses, such as automobile crash simulation, or sheet-metal forming simulation. We have reported the automated quadrilateral mesh generation method with flexible directionality control, that is useful to satisfy the various requirements of the numerical analyses.
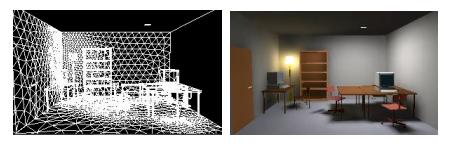
Radiosity is a method for generating photo-realistic images, by calculating the light energy of each polygons in a scene. Often meshing methods are applied to generate the small polygons from a rough geometric model, The quality of meshing results is very important in the view of image quality, data size, and rendering time. We have implemented the adaptive meshing system for radiosity, and had a demonstration at SIGGPAGH '98.
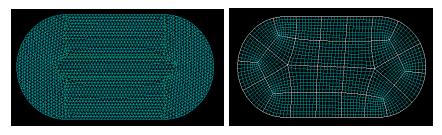
Surface reconstruction is a method that converts a set of fine triangular elements or unorganized points into the fewer number of parametric surfaces. Experimentally we found that the continuity and smoothness of surfaces strongly depends on the topology of quadrilateral patches. We are now developing a method for constructing the topology of quadrilateral patches for surface reconstruction.
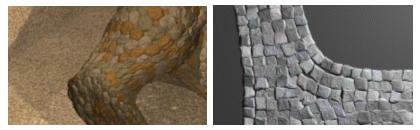
Texture Generation is a technique for automatically generating the detailed geometry of surfaces for realistic image synthesis. Many of computer graphics techniques applied texture mapping, which maps real images onto surfaces of geometric objects, however, it is often difficult to fit images onto arbitrary geometry. Our technique generates realistic images of stones and animals by automatically generating the detailed geonmetry onto arbitrary geometric models.
Hierarchical Data Visualization is a very useful technique since there are variety of hierarchical data around our daiy life. We developed Data Jewelry Box, which is the technique for representing whole large-scale hierarchical data in one limited display space, by packing data items in a 2D rectangular space. We used the technique for various applications, such as visualization of Web access logs, and monitoring of distributed computer environments.